Description
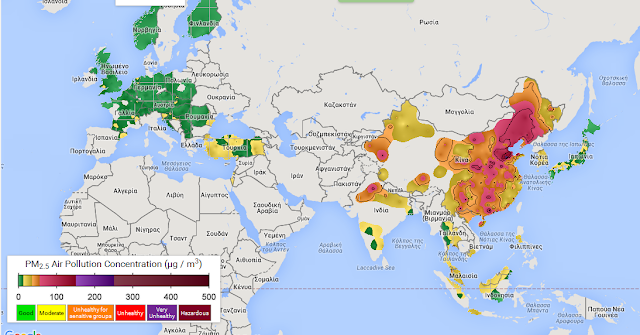
This map provides near real-time information on particulate matter air pollution less than 2.5 microns in diameter (PM2.5). Under typical conditions, PM2.5 is the most damaging form of air pollution likely to be present, contributing to heart disease, stroke, lung cancer, respiratory infections, and other diseases.The data presented here has been constructed from surface station measurements, and tends to be a couple hours behind real-time. The initial version of this map uses several hundred stations from inside China, and we will be adding data from more stations in China and elsewhere around the world in the future. The available station data is interpolated using Kriging-based techniques to create a continuous estimate of air quality conditions. The interpolation process is designed to smooth the data and remove some of the local noise in order to produce estimates for regional average air pollution.
Health indicators and qualitative descriptions are included based on the US EPA’s air quality index (AQI) standard for 24-hour exposure.
http://berkeleyearth.org/air-quality-real-time-map/


No comments :
Post a Comment